This is part of a series of articles to show you solutions to common finance tasks related to financial planning, accounting, tax calculations, and auditing, all implemented with the low-code KNIME Analytics Platform.
Increasing numbers of banks are adopting machine learning to compute credit scores to deliver better performance than traditional methods. In such cases, the bank clerk trains a prediction model on data about loan applicants, evaluates the model's performance, and then uses the model on new incoming loan applications to assign applicants a credit score. This would function perfectly if we assume that any mistakes made by the prediction model are the same. But they're not.
Granting a loan to a customer who will never repay it is worse than denying a loan to a creditworthy customer.
In the video and write-up below, learn how you can train a machine learning model to predict credit scores and additionally how you can determine when you need to optimize the model by assessing the cost of a mistake. We use the low-code KNIME Analytics Platform to train and optimize the model. The intuitive, user-friendly interface of the tool enables anyone to start using modern data science methods without having to learn to code first.
The task: Train and optimize a machine learning model for credit scoring
When making predictions with a machine learning model, it's unlikely you'll achieve 100% accuracy. The model will never be perfect. It will surely make mistakes. Mistakes can be costly, especially in particular domains, like medicine. Then, what is the cost of a mistake? Is it worth it to optimize my model even more and gain that 1% of accuracy?
In the article, How to optimize the classification threshold, you can learn how to optimize the classification threshold of a classifier predicting whether or not to grant loans to the customers of a bank. Let's revisit that use case.
It's classic credit scoring. Of the many applicants asking the bank for loans, which ones should we grant the loans to? Applicants can easily be separated in two groups: the ones who repay the loans and the ones who do not. The goal is to assign the loan to the first group of customers and deny it to the second group.
The loan granting process usually requires some manual steps to evaluate the applicant’s assets, age, credit history, and so on. During this manual process, mistakes will be made for sure. Every now and then, loans will be granted to applicants who will not repay them, and loans will be refused to applicants who would have otherwise repaid them. A good clerk produces only a minimum number of such mistakes. But how much does a mistake cost to the bank? Are all mistakes the same?
A commonly used dataset to infer credit worthiness of applicants is the German Credit Data Set, available on the site of the University of California Archive for Machine Learning and Intelligent Systems.
The dataset contains 1000 loan applicants. Each applicant is described via 20 features, grouped in:
- socio-demographic features, like age and married/unmarried status.
- financial features, like income and other wealth indicators.
- personal features, like job, housing, and properties.
- Loan request data, such as loan amount and purpose.
The target variable (column 20) describes the applicant's creditworthiness as evaluated by the bank clerk (2 = risky and 1 = creditworthy). 700 applicants (70%) are labeled as creditworthy in the dataset and 300 applicants (30%) as risky.
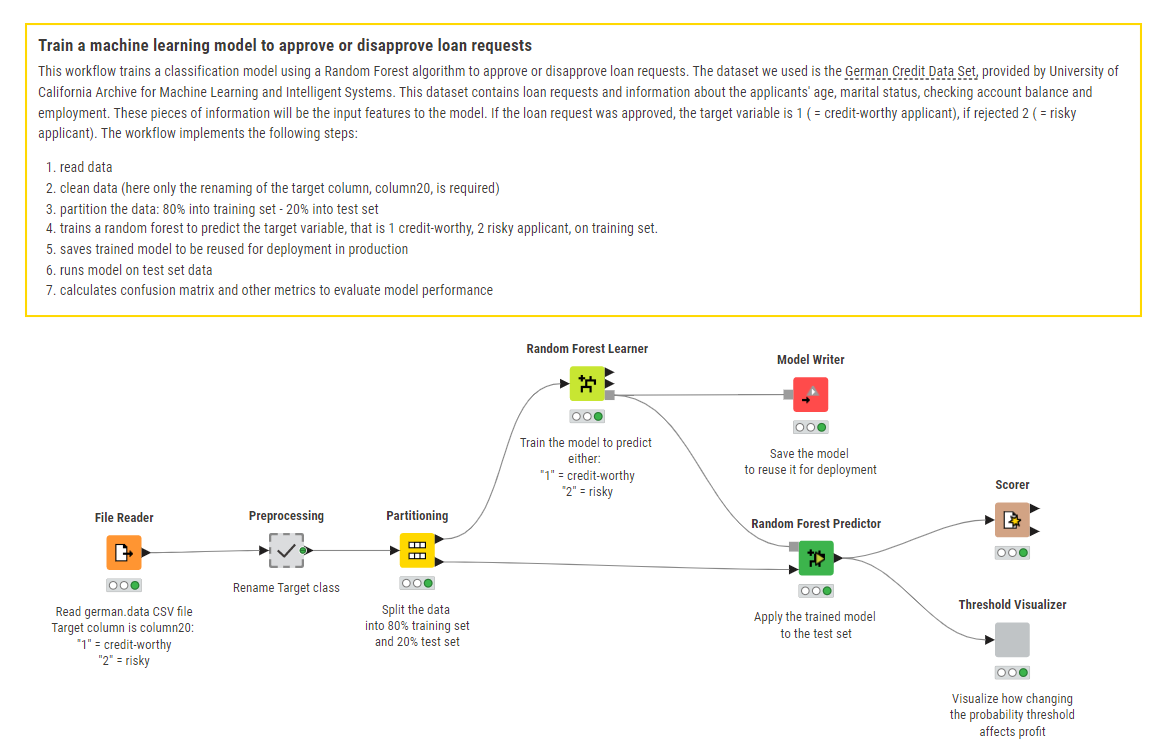
The workflows: Train a machine learning model to approve or disapprove loan requests
Let’s replace our human clerk with a machine learning algorithm, like a random forest, and let’s train it to distinguish the applicants that are worth a loan from those who are not worth it. The workflow below reads the data from the “German Credit Dataset” file, splits it in two datasets – one for training and one for testing -, prepares the data, trains the machine learning model to predict whether the applicant is trustworthy or risky, (i.e. whether to grant or reject a loan request), and then evaluates how well the model performs on the test set.
You can download the workflow loan_request_training for free from KNIME Community Hub.
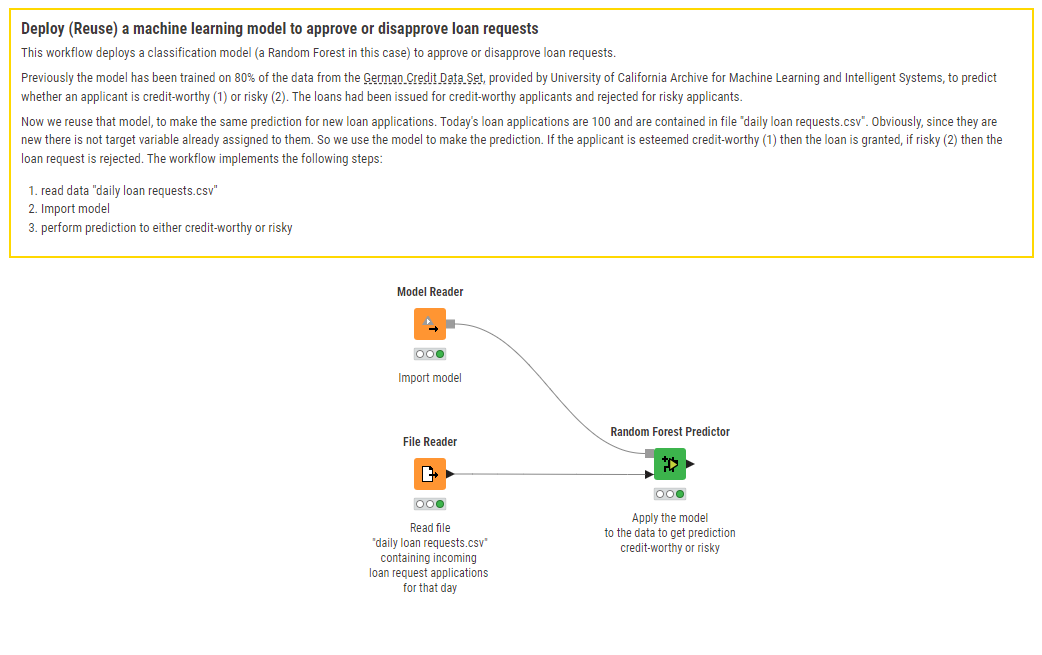
A separate workflow deploys the trained model on new data. That is, it reads the trained model and applies it to evaluate the new incoming loan applications day after day, in everyday bank operations.
The deployment workflow loan_request_deployment is also publicly available to download from KNIME Community Hub.
Notice that the trained model in the end produces a probability of the applicant being risky. Decisions about granting loans depend on how conservative we are at evaluating this probability. The lower the threshold applied to the probability, the more conservative the decision process.
In production the model operates on real data, and we do not have the luxury of knowing whether the model makes a mistake, time will be the ultimate judge. We can only evaluate how correct the model is on the test set, where the real evolution of the applicant is fully known.
For the model performance evaluation, usually, a confusion matrix is calculated on the data of the test set. The confusion matrix is a way of counting the number of correct predictions and the number of mistakes. You can see in each cell:
- The number of applicants who were correctly labeled as trustworthy. In this case, the bank would correctly grant their loan request.
- The number of applicants who were incorrectly labeled as risky, but they were trustworthy. The bank would deny their loan request, but if granted they would have repaid it.
- The number of risky applicants erroneously labeled as trustworthy. This is probably the biggest mistake the bank could make, because it would grant a loan that would never be repaid, thus losing the whole loan amount.
- The number of applicants who were correctly judged as risky, and their loan request was rejected.
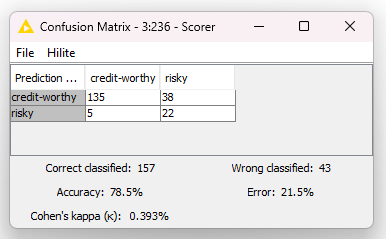
As it is now, for that random choice of data for the training and test set, our model is correct on 78.5% of the applicants and wrong on the remaining 21.5%.
The total percentage of mistakes on the test set applicants is 21.5%. However, not all mistakes are the same. Are we sure that refusing a loan to a potential good customer has the same value as granting a loan to somebody who will not pay it back? Every mistake has its cost. Also, every correct decision has its profit. Rejecting a risky loan request produces zero profit, while granting a trustworthy loan request will produce in the long term some profit for the bank. While we want to grant loans to the worthy applicants, we want even more to refuse loans to the unworthy applicants. Let’s delve a bit deeper on that.
How to quantify the cost of a decision
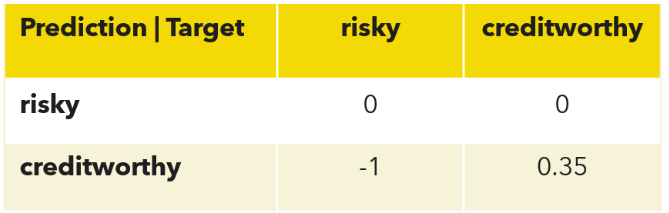
It is not easy to quantify the cost of decisions. The article "An analysis of profit and customer satisfaction in consumer finance case studies” in Business, Industry And Government Statistics, 2, pages 147-156, 2014, by C. Wang & M. Zhuravlev assigns the following cost/profit factor w to each one of the possible decisions in credit scoring.
In general, refusing a loan does not bring any loss. The loan is not granted, the money cannot be lost. In this case, the cost/profit w=0.
- w=0 for correctly refusing a loan to risky customers. This means that rejecting a risky customer bears no cost and no profit.
- w=0 also for incorrectly refusing a loan to a creditworthy customer. This decision, though incorrect, bears no cost to the bank. Obviously, it is a mistake, but not a serious one. If we must make mistakes, these are the easiest ones to make. The loan will be refused, no money is lost.
Granting a loan is the decision that bears consequences. If we grant the loan to a creditworthy customer, the average profit depends on the loan interest. If we grant a loan to a risky customer, we will lose it all. In this case, the cost factor is w=-1. In [2] it was estimated:
- w=0.35 for correctly granting a loan to creditworthy customers. On average a customer repaying a 1 € debt brings a 0.35 € profit to the bank.
- w=-1 for incorrectly granting a loan to risky customers. Assigning a loan to a risky customer has a cost of -1 € for each 1 € of the loan.
The results: A threshold visualizer for accurate credit scoring
Total profit/cost on the test set: Let’s consider 200 loan requests coming in every day, with applicants distributed 70% (140) - 30% (60) across the two classes, and an average loan amount of 10 000 €.
Let’s also suppose that our machine learning model is perfectly correct, then every day the bank invests for a full profit/cost of:
"profit/cost"=140*0.35+60*0*10 000 €=490 000 €
Let’s now suppose that our model accepts all loan applications. In this case the daily total investment is:
"profit/cost"=140*0.35+60*(-1)*10 000 €=-110 000 €
Let’s now suppose that our model denies all loan applications. In this case the daily investment would be:
"profit/cost"=140*0+60*0*10 000 €=0 €
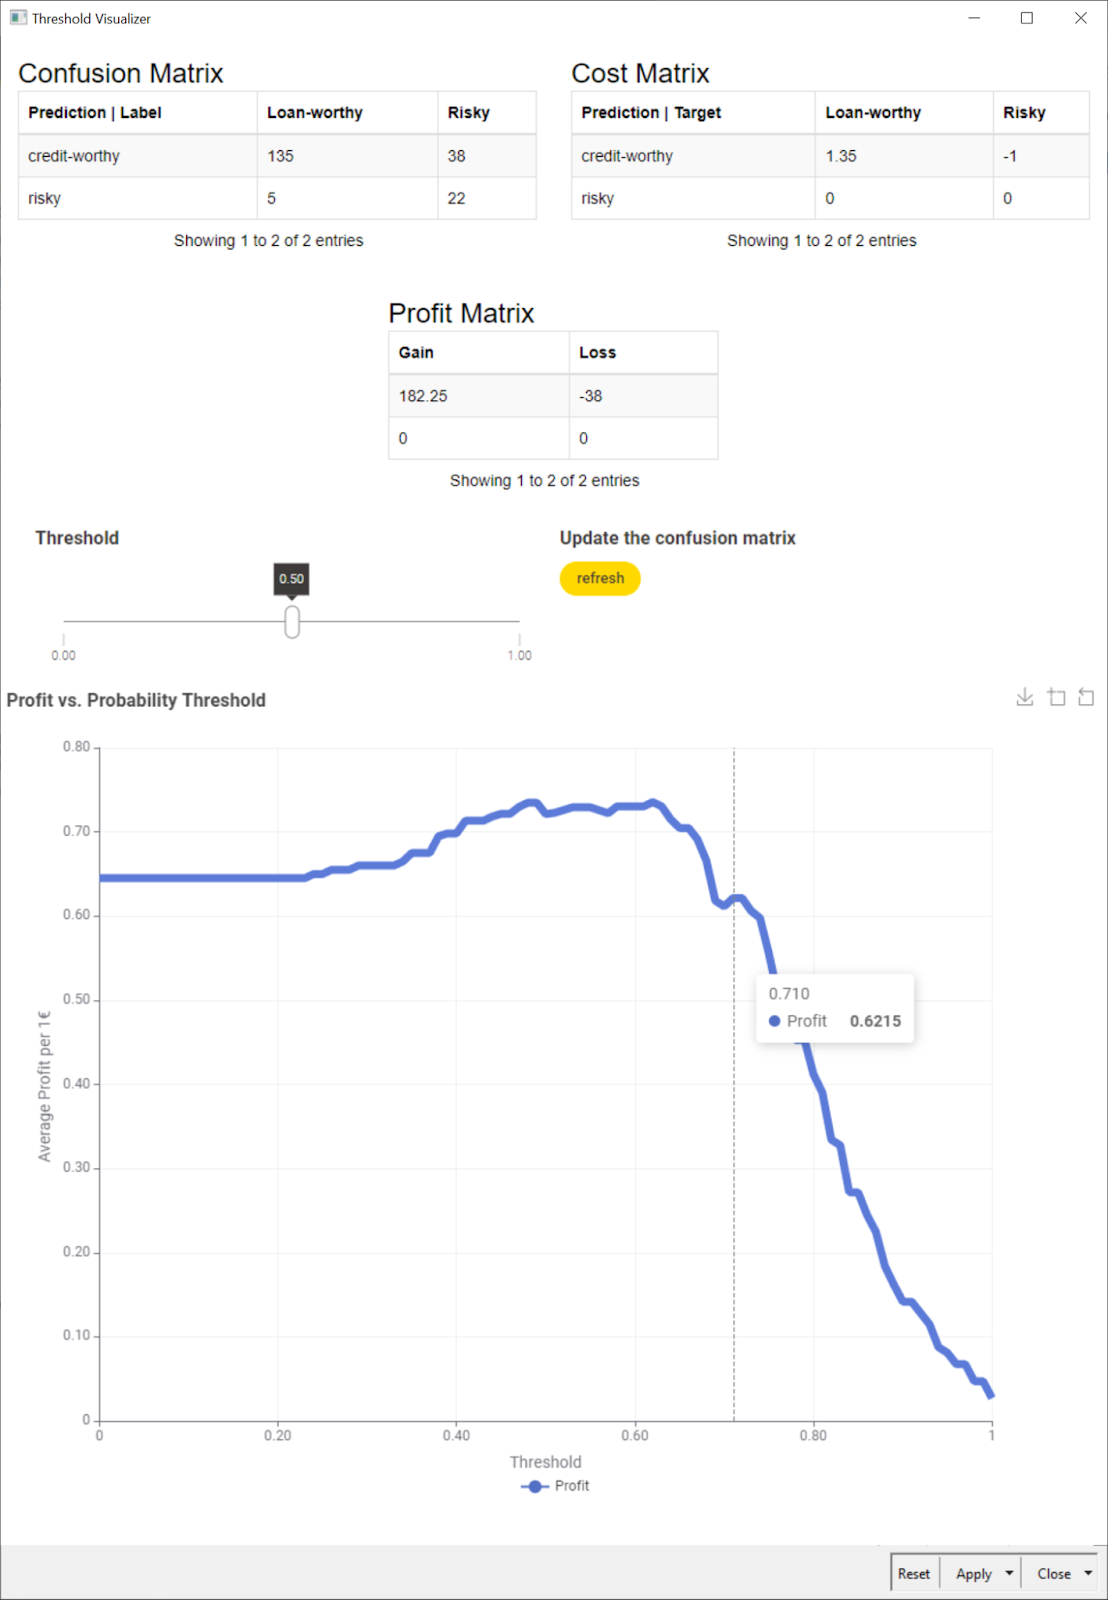
The machine learning model will not work perfectly. It will perform in between these numbers and will lose or make money in between these amounts. For the confusion matrix in Fig. 2, for example, the investment would be:
"profit/cost"=135*0.35+38*-1+22*0+5*0*10 000 €=92 500 €
Is it possible to steer the model decisions in the direction that makes more money?
Choosing the threshold appropriately: After training, the machine learning model produces the probability for the input applicant to belong to one of the two classes: creditworthy or risky. By default, if the probability of the customer being risky p is above 0.5, the loan request is rejected. On the opposite, if the probability of the customer being trustworthy 1-p exceeds 0.5 then the loan request is granted. The default threshold is 0.5, which means we consider both decisions equally costly. What about changing the threshold value to favor one or the other class?
For example, instead of a threshold of 0.5 we could use a threshold of 0 for probability p. This means that we reject all loan applications, ending up with the “0 profit - 0 loss” situation. If we use a threshold of 1, we accept all loan requests, leading to a loss of circa -110k €. We can vary the threshold till we find the most rewarding value given the cost matrix that we presented above [1].
This task was implemented in the “Threshold Visualizer” component. The composite view of this component shows the new confusion matrix, including the cost matrix, and how it varies when selecting a different decision threshold.
An important addition to the classic model training cycle
We wanted to show the process of training a machine learning model to predict successful loan applications. A common approach is to read the data, split it in training and test set, prepare the data, train the model, and evaluate the model performance on the test set. Then a deployment workflow is created, consuming the trained model on new incoming loan applications.
This is all considering that all mistakes are the same. Granting or not granting a loan to a risky or to a creditworthy customer does not make a difference. This is not true. Granting a loan to a customer who will never repay it is worse than denying a loan to a creditworthy customer. We assigned a cost / profit to each decision, which translated into a total cost / profit when applied to all decisions on the whole data set. Suddenly a 1% more in accuracy means an increase in profit or cost depending on the class affected by the accuracy improvement.
Varying the threshold of the model decision and optimizing it in terms of total cost on the test set becomes an important step to add to the classic model training cycle.
Download KNIME and try out the workflows in this article for your own credit scoring use cases.