Many modern data analysis environments allow for code-free creation of advanced analytics workflows. The advantages are obvious: more casual users, who cannot possibly stay on top of the complexity of working in a programming environment, are empowered to use existing workflows as templates and modify them to fit their needs, thus creating complex analytics protocols that they would never have been able to create in a programming environment. At the same time, these visual environments serve as an excellent means for documentation purposes. Instead of having to read code, the visual representation intuitively explains which steps have been performed and – in most environments at least ‒ the configuration of each module is self-explanatory as well. This enables a broad set of intuitively reusable workflows to be built up capturing the data scientists’ wisdom.
This is only one side of the coin, however. Directly writing code still is and always will be the most versatile way to quickly and flexibly create a new analysis. In some areas this may not be as dramatic, as the need for new ways of solving (parts of) problems isn’t as critical anymore and a carefully designed visual environment may capture everything needed. In Advanced Analytics, however, the opposite is true: this is still very much a field under active development as we currently witness in Deep Learning and Distributed Algorithms for Big Data (to name just two examples). Hence, in order to truly get full value out of your data, experts need to be able to quickly try out a new routine either written themselves or by their colleagues.
The real question is therefore not which of the two paradigms to choose but how to make sure that users get the best of both worlds: ease of (re)use and versatility. Again, this boils down to the openness of the platform you are choosing for your analytics – can you really afford to lock today’s and tomorrow’s data scientist into a visual workbench that supports just one analytical language? Which one? A truly open platform allows you to choose what you – and more importantly – your data scientists are comfortable using and allows them to collaboratively use what they know best without having to learn the nuts and bolts of every other coding paradigm used in your organization.
In the following I will describe how KNIME bridges this gap: integrating analytical languages, such as R and Python and visual design of SQL code. But I will also describe how this helps to integrate current developments on the Big Data front and how the same paradigm allows the wealth of existing JavaScript visualization libraries to be seamlessly integrated as well.
Analytics: Modular R and Python
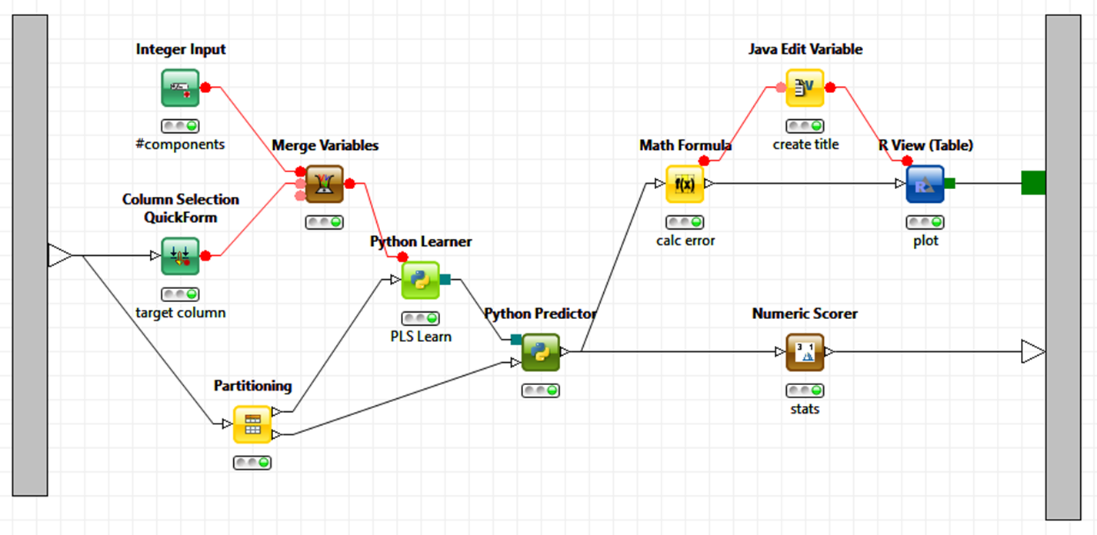
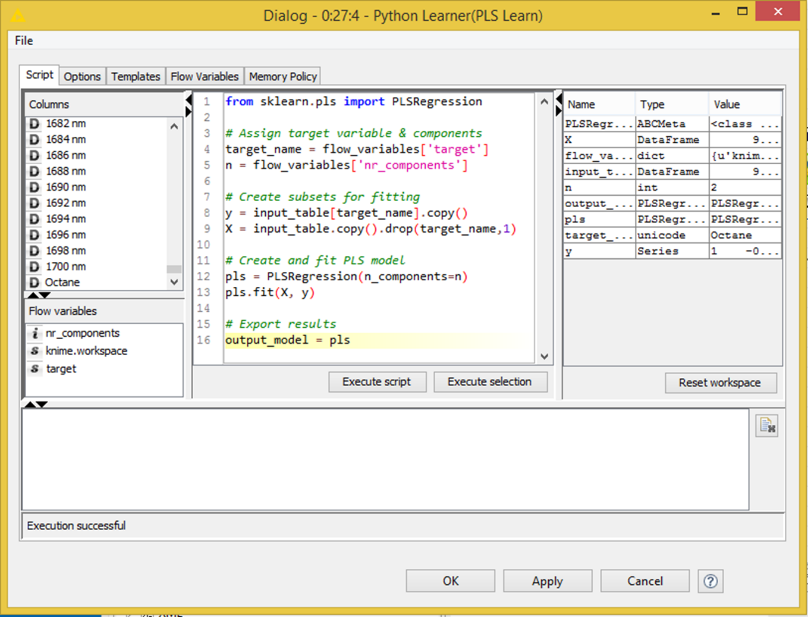
The most important scripting languages for data analysis are, of course, R and Python. The screenshot below shows how expert code written in those two languages can be integrated in a KNIME analytical workflow. In this example R is used to create a graphic and Python for the model building (not because this is necessarily a good choice but simply to demonstrate that we can do that). A different user can now simply pick up this workflow and re-use it, possibly never even looking at the underlying code pieces. In KNIME, the entire sub-workflow could even be encapsulated in a metanode and exposed as a new functional unit without anyone even needing to see what’s going on inside; we can also expose only those parameters that we want to be controlled from the outside, modeled by the green QuickForm nodes, taking this to yet another level of abstraction.
Similar integrations exist also for other languages such as Groovy and Matlab, some contributed by the ever active KNIME community.
ETL: Visual SQL
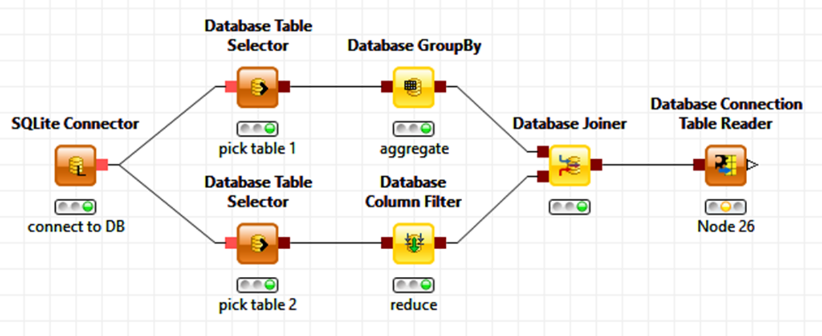
Data loading and integration is the part nobody really talks about much. But here too, experts are capable of writing a few lines of SQL a lot faster than putting together a few modules graphically. However, not everyone is sufficiently fluent in SQL and also these users should still be given the ability to mix and match their data, giving them access to the majority of the functionality available via SQL (and remembering the many little nuances of it for different databases). In this case we cannot use the parameter based customization from above. Instead, KNIME encapsulates SQL fragments visually as individual nodes. The figure below shows what this could look like for an example workflow accessing two tables in a database and joining them after a couple of aggregation operations. Notable here is that this series of nodes will not be executed within the KNIME workflow environment itself but pushed out to the database – in fact KNIME silently assembles the underlying SQL statement under the hood (and if you’re curious, it is available on the node view). And, to make things even easier, depending on the initial database connector node, KNIME also makes sure only supported operations (such as for the aggregation node) are available and creates the right SQL dialect for that particular database.
Big Data: Wrapping Hadoop
The visual SQL approach described above also allows KNIME workflows to model and control ETL operations natively on Hadoop – using one of the Cloudera, Hortonworks, or MapR certified connectors works just the same as running operations in your local MySQL database ‒ but suddenly things get executed on Hadoop.
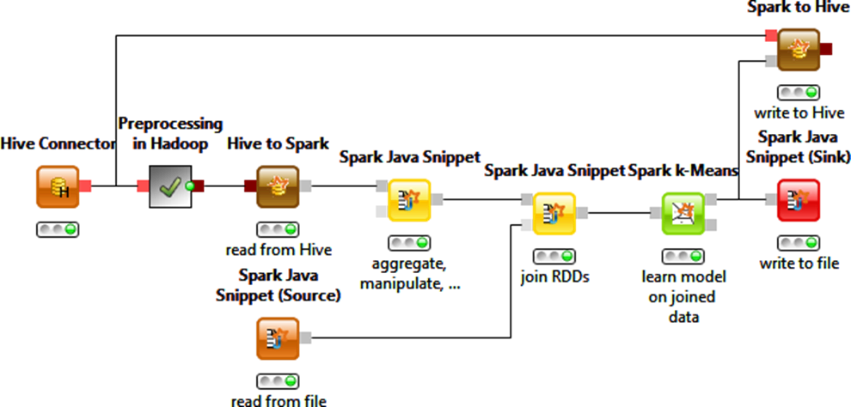
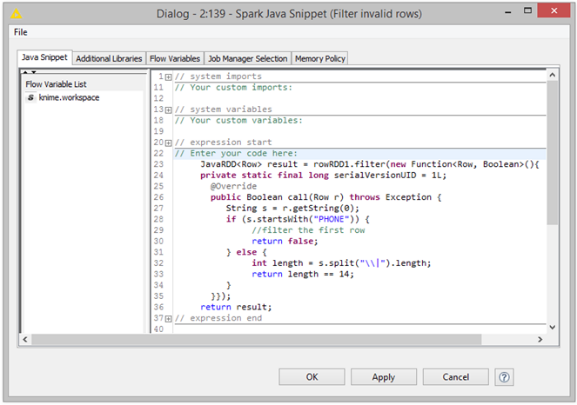
But why stop there? If you can reach out to R and Python and SQL, why not also add nodes that allow the integration of code that runs directly on Hadoop as well? With version 2.12, KNIME has nodes to encapsulate calls to MLlib and enables Spark operations to be modeled. A special Spark Scripting node encapsulates functionality that has not yet been exposed as a native node as well. The figure below shows an example of such a workflow.
Visualization: JavaScript, the fourth musketeer
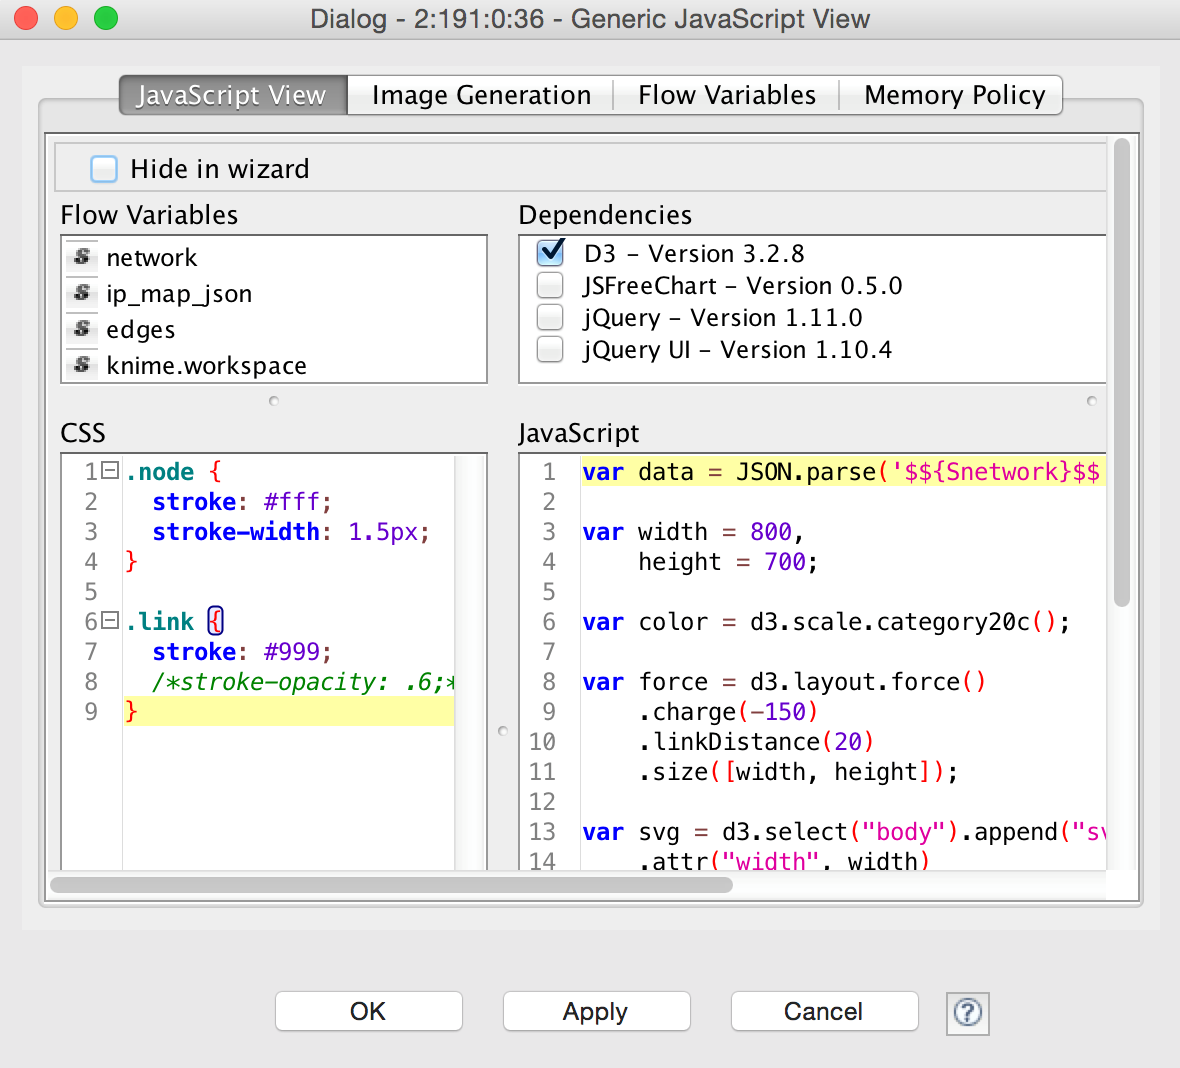
And finally, instead of building yet another visualization library or tightly coupling pre-existing ones, KNIME has recently also introduced a JavaScript node that quickly builds new visualizations and exposes them as KNIME nodes, the figure below shows an example of network graphics generated using the well-known D3 library, wrapped nicely into a KNIME node. But other libraries are available as well, of course, and one of the neat features of this concept is that the resulting view nodes can be used to display visualizations in the KNIME WebPortal as well, allowing the deployment of web based interactive workflow controls, enabling true Guided Analytics – but that’s a story for another blog post.