
In this blog series we’ll be experimenting with the most interesting blends of data and tools. Whether it’s mixing traditional sources with modern data lakes, open-source devops on the cloud with protected internal legacy tools, SQL with noSQL, web-wisdom-of-the-crowd with in-house handwritten notes, or IoT sensor data with idle chatting, we’re curious to find out: will they blend? Want to find out what happens when IBM Watson meets Google News, Hadoop Hive meets Excel, R meets Python, or MS Word meets MongoDB?
Today: A Cross-Platform Ensemble Model: R meets Python and KNIME. Embrace Freedom in the Data Science Lab
The Challenge
Today’s challenge consists of building a cross-platform ensemble model. The ensemble model must collect a Support Vector Machine (SVM), a logistic regression, and a decision tree. Let’s raise the bar even more and train these models on different analytics platforms: R, Python, and of course KNIME. (Note that we, of course, could create all those models in KNIME but that would kill the rest of the story...)
A small group of three data scientists was given the task to predict flight departure delays from Chicago O’Hare (ORD) airport, based on the airline data set. As soon as the data came in, all data scientists built a model in record time. I mean, each one of them built a different model on a different platform! We ended up with a Python script to build a logistic regression, an R script to build an SVM, and a KNIME workflow to train a decision tree. Which one should we choose?
We had two options here: select the best model and claim the champion; embrace diversity and build an ensemble model. Since more is usually better than less, we opted for the ensemble model. Thus, we just needed to convince two out of the three data scientists to switch analytics platform.
Or maybe not.
Thanks to its open architecture, KNIME can easily integrate R and Python scripts. In this way, every data scientist can use his/her preferred analytics platform, while KNIME collects and fuses the results.
Today’s challenge has three main characters: a decision tree built on KNIME Analytics Platform, an SVM built in R, and a logistic regression built with Python. Will they blend?
Topic. Flight departure delays from Chicago O’Hare (ORD) Airport.
Challenge. Build a cross-platform ensemble model, by blending an R SVM, a Python logistic regression, and a KNIME decision tree.
KNIME Extensions. Python and R Integrations.
The Experiment
Data Access.
- We used data from the “airline data set” for the years 2007 and 2008. The data were previously enriched with external information, such as cities, daily weather, US holidays, geo-coordinates, and airplane maintenance records. The Table Reader node is used to read the data set.
Preprocessing.
- Binning. Some columns, such as distance and departure and arrival times, were binned into only a few segments.
- Missing Values. Data rows with no Departure Delay value were removed. Other missing values were substituted with specific knowledge-based fixed values. Then, all string values were converted into numbers.
- Partitioning. Data rows referring to year 2007 were used as training set; data rows referring to year 2008 were used as the test set.
- Normalization. SVM requires normalized input values in [0,1].
- DepDelay column was selected as target to train the models.
Model Training.
- A Decision Tree Learner node was used to train a decision tree on KNIME Analytics Platform.
- An R Learner node was implemented to run the R script that trains a Support Vector Machine in R. Please notice that the R svm() function has scalability issues and therefore a Row Sampling node is used to reduce the training set size to 10000 randomly extracted rows (the KNIME implementation doesn't have that issue).
- A Python Learner node was introduced to execute the Python script to train a logistic regression model using Python Scikit library.
- The three nodes were placed inside a metanode to produce a KNIME PMML model, an R model, and a Python model.
- Next, the subsequent metanode runs the appropriate Predictor nodes to evaluate the models on the test set and joins the prediction columns into a single data table. Here the Prediction Fusion node combines all predictions through the median. Other operators are also available.
The Prediction Fusion node is only one way to build an ensemble model. Another way would include transforming each model into a PMML data cell (using, for example, the R to PMML node and the JPMML-SkLearn Python library), collecting all models into a data table with a Concatenate node, transforming the data table into an ensemble model with a Table to PMML Ensemble node, and finally creating the ensemble predictions with a PMML Ensemble Predictor node. However, for this experiment we preferred to use the Fusion Prediction node, as it is more flexible for the integration of external models.
Figure 1. This workflow builds a cross-platform ensemble model by blending together three different models from three different analytics platforms, i.e. an SVM from R, a Logistic Regression from Python and a decision tree from KNIME. In this case, the ensemble predictions are calculated by a Prediction Fusion node on the basis of the predictions produced by the three single models.
(click on the image to see it in full size)
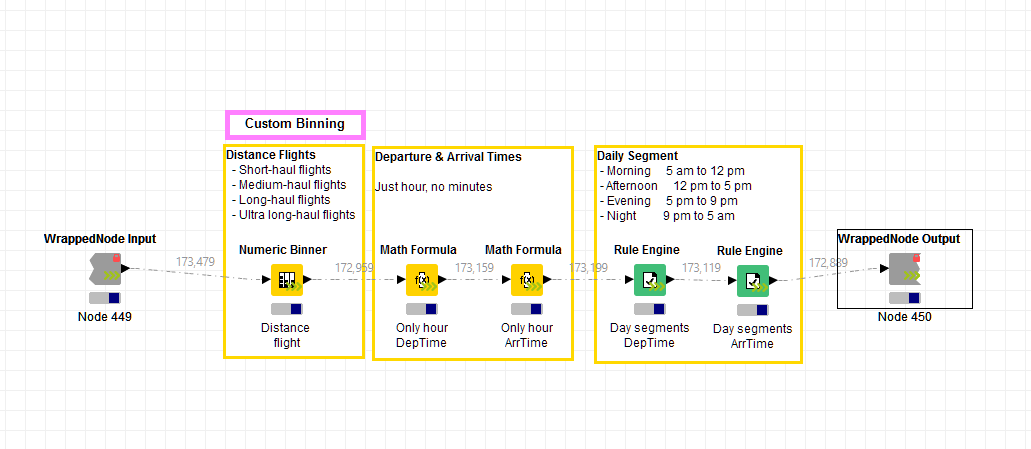
Note. Have a look at the first wrapped node in the workflow, the one called “Binning”. Can you see the arrow in its lower right corner? This is a node that runs on the KNIME Streaming Executor. It executes its nodes in parallel as much as possible. When the first node has finished processing the current data package, the subsequent node can already start execution on the transmitted data. This cuts down on I/O and memory usage as only the few rows 'in transit' need to be taken care of, which should speed up calculations.
Figure 2. The Streaming Executor engine executes nodes concurrently inside the wrapped node.
(click on the image to see it in full size)
The Results
Yes, they blend!
Platform blending as well as model blending were successful!
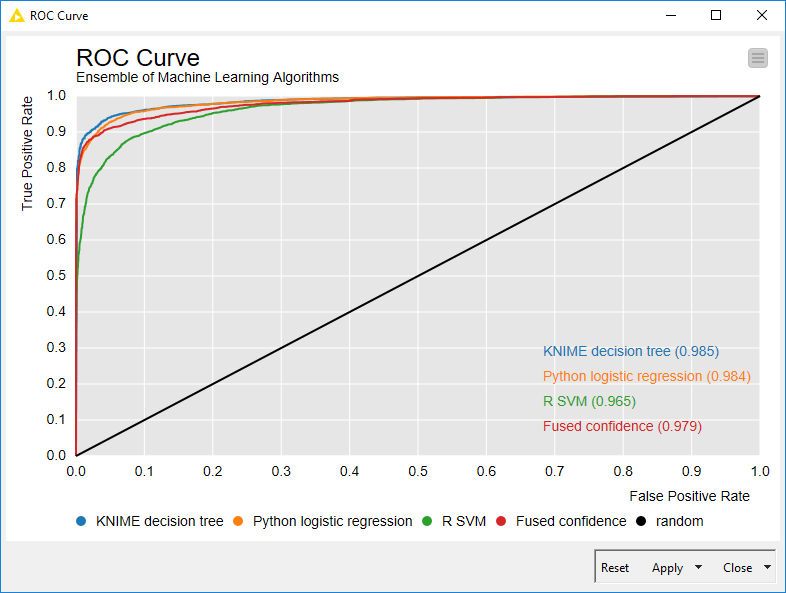
The last step was to assess the quality of the ensemble model vs. the single models. To do this, we used the Java Script ROC Curve node. Our cross-platform ensemble model shows performances in between those of its single parts, as you can see from the ROC curves below.
With this experiment we proved that KNIME Analytics Platform enables freedom in the Data Science Lab by allowing data scientists to use their preferred analytics platform and by integrating models and results into a KNIME workflow.
Figure 3. ROC curves of the cross-platform ensemble model (Fused confidence) and of the single model components (KNIME decision tree, Python Logistic Regression, and R SVM).
(click on the image to see it in full size)
Coming next...
If you enjoyed this, please share it generously and let us know your ideas for future blends.
For the next challenge we thought of something more festive. What about discovering the secret cookie ingredient used by the competition for the ultimate Christmas cookie? What about ingredients extracted from a MS Word document and ingredients extracted from a web page through web crawling? Will they blend?