
Your flight is boarding now
The Challenge
Today’s challenge is weather-based - and something we’ve all experienced ourselves while traveling. How are flight departures at US airports impacted by changing weather patterns? What role do weather / temperature fluctuations play in delaying flight patterns?
We’re sure the big data geeks at the big airlines have their own stash of secret, predictive algorithms but we can also try to figure this out ourselves. To do that, we first need to combine weather information with flight departure data.
On the one hand, we have a whole archive of US flights over the years, something in the order of millions of records, which we have saved on a big data platform, such as Hadoop Hive. On the other, we have daily US weather information downloadable from https://www.ncdc.noaa.gov/cdo-web/datasets/ in the form of Excel files. So, a Hadoop parallel platform on one side and traditional Excel spreadsheets on the other. Will they blend?
Topic. Exploring correlations between flights delays and weather variables.
Challenge. Blend data from Hadoop Hive and Excel files.
Access Mode. Connection to Hive with in-database processing and Excel file reading.
The Experiment
- We have data for the years 2007 and 2008 of the “airline data set” already stored on an Apache Hive platform in a cluster of the AWS (Amazon Web Services) cloud. The “airline data set” has been made available and maintained over the years by the US Department of Transportation’s Bureau of Transportation Statistics and it tracks the on-time performance of US domestic flights operated by large air carriers.
- To access the data in the Apache Hive platform, we use the KNIME nodes for in-database processing. That is, we start with a Hive Connector node to connect to the platform; then we use a Database Table Selector node to select the airline data set table and a Database Row Filter node to extract only Chicago O’Hare (ORD) as the origin airport. The Hive Connector node, like all the other big data connector nodes for Impala, MapR, Hortonworks, etc …, is part of the KNIME Performance Extensions and requires a license.
- The goal here is to assess the dependency of flight departure delays on local weather. Daily weather data for all US major locations are available at https://www.ncdc.noaa.gov/cdo-web/datasets/ in the form of Excel Weather data for ORD airport only have to be downloaded to be joined with the flight records extracted from the Apache Hive data set in the previous step.
- At this point, we have two options: we can upload the climate data to Apache Hive and perform an in-database join on the big data platform or we can extract the flight records from Apache Hive into KNIME Analytics platform and perform the join operation in KNIME. Both options are viable, the only difference being in the execution time of the joining operation.
Option 1. In-database join
- 4a. A Hive Loader node imports the weather data from Excel into Hive. For this operation, you can use any of the protocols supported by the file handling nodes, e.g. SSH/SCP or FTP. We chose SSH and used an SSH Connection node.
- 4b. The Database Joiner node now joins the weather data for Chicago International Airport with the flight records of the airline dataset by date.
- 4c. Now that we have all of the data in the same table, the Hive to Spark node transfers the data from Hive to Spark. There we run some pre-processing to normalize the data, to remove rows with missing values, and to transform categories into number.
- 4d. Finally, the Spark Statistics node calculates a number of statistical measures, and the Spark Correlation Matrix node computes the correlation matrix for the selected input columns on the Spark cluster. The resulting table is transferred back for further analysis into KNIME Analytics Platform.
Option 2. In-KNIME join
- 4a. Selected flight data are imported from Hive into KNIME Analytics Platform using a Database Connection Table Reader node. The Database Connection Table Reader node executes in-database the SQL query at its input port and imports the results into KNIME Analytics Platform.
- 4b. Next, a Joiner node joins the flight data for Chicago Airport with the weather data from the Excel file by date.
- 4c. At this point, the same preprocessing procedure is applied as in item 4c.
- 4d. Finally, the Statistics node and the Linear Correlation node calculates the same statistical measures and correlations between departure delays and weather related variables.
The KNIME workflow including a branch for each one of the two options is shown in the figure below.
Figure 1. Data Blending Hive - Excel
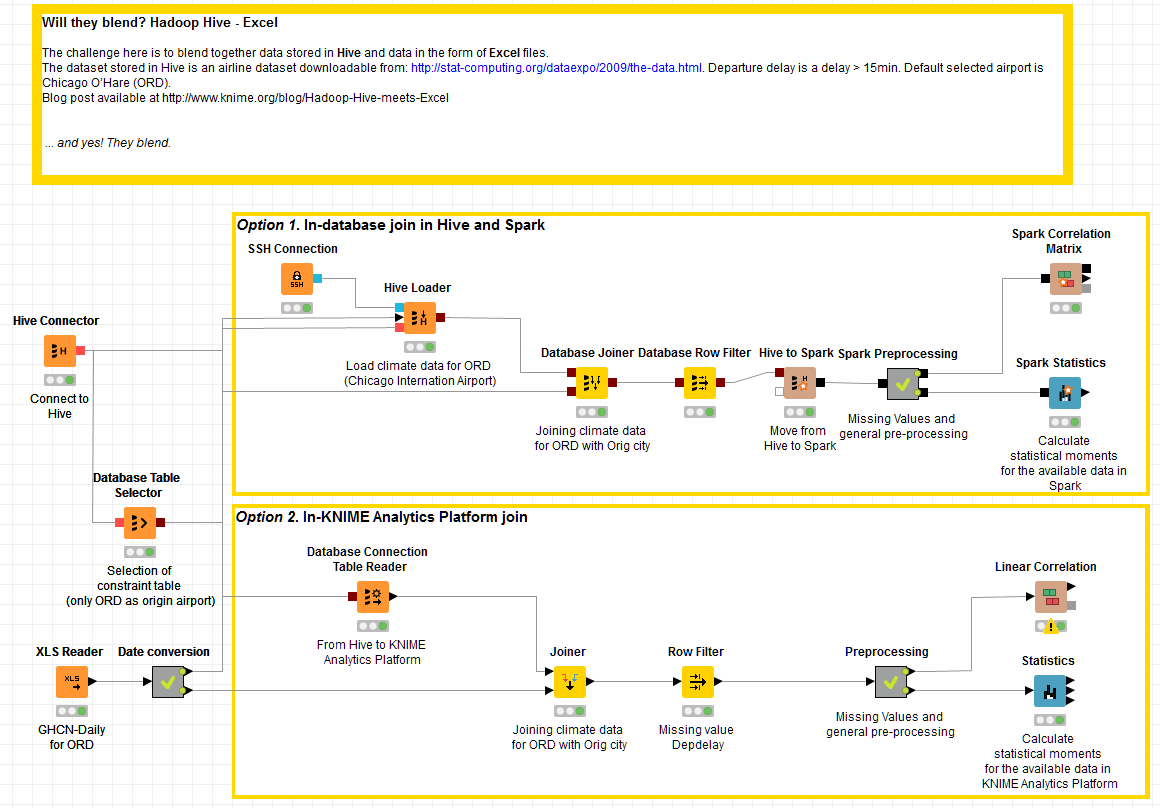
(click on the image to see it in full size)
While the approach described in option 1 is faster - as it takes advantage of parallel computation - the approach described in option 2 is simpler to implement.
To conclude: you can always choose the best mix of Hadoop, Apache Spark, and KNIME nodes to suit the problem at hand!
The Results
Yes, they blend!
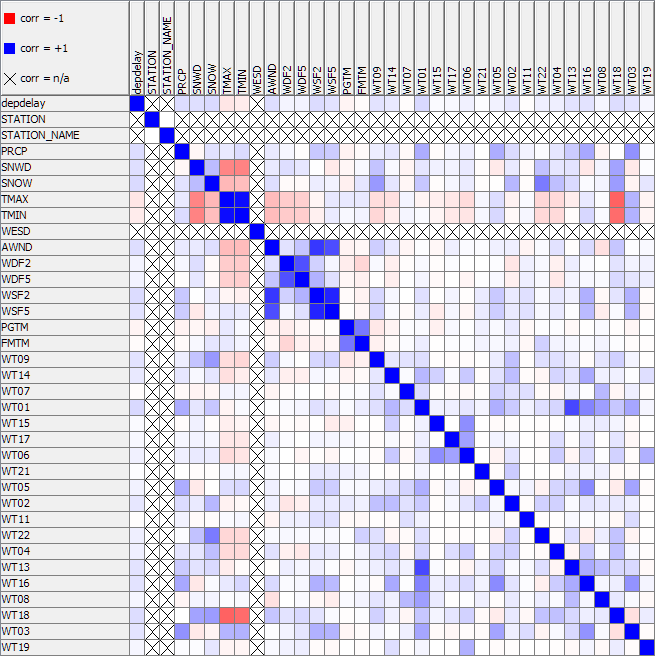
The correlation matrix shows some correlation (0.12) between snow alert codes and departure delays in Chicago. The correlation level is not so high, since snow is not the only cause for flight departure delays. Rain, for instance, is also correlated. This is hardly surprising.
Figure 2. Correlation matrix
However, what was surprising in this experiment was how easy it is to blend data from a modern Hadoop platform (any really) with a traditional Excel file!
Indeed, by just changing the connector node at the beginning of the workflow, the experiment could have run on any other big data platform. Notice that in this case only the connector node would change; the in-database processing part would remain unaltered.
Another surprising conclusion from this experiment is the flexibility of KNIME analytics Platform and its Performance Extensions. Indeed, mix and match is allowed and it can take you to the optimal degree of Hadoop, Spark, and KNIME, for the best compromise between execution complexity and execution performance.
So, even for this experiment, involving Hadoop Hive on one side and Excel files on the other side, we can conclude that … yes, they blend!
Coming next...
If you enjoyed this, please share it generously and let us know your ideas for future blends.
We’re looking forward to the next challenge. What about blending live data from Twitter with an archive of tweets on a database, say PostgreSQL? Will they blend?